
How to Analyze Survey Responses
INFO
The Survey Analytics workbench provides real-time, interactive exploration of survey responses. Every chart serves as both a visualization and an interactive cross-filter, powered by an in-memory multidimensional data cube that coordinates all views in under 30 milliseconds.
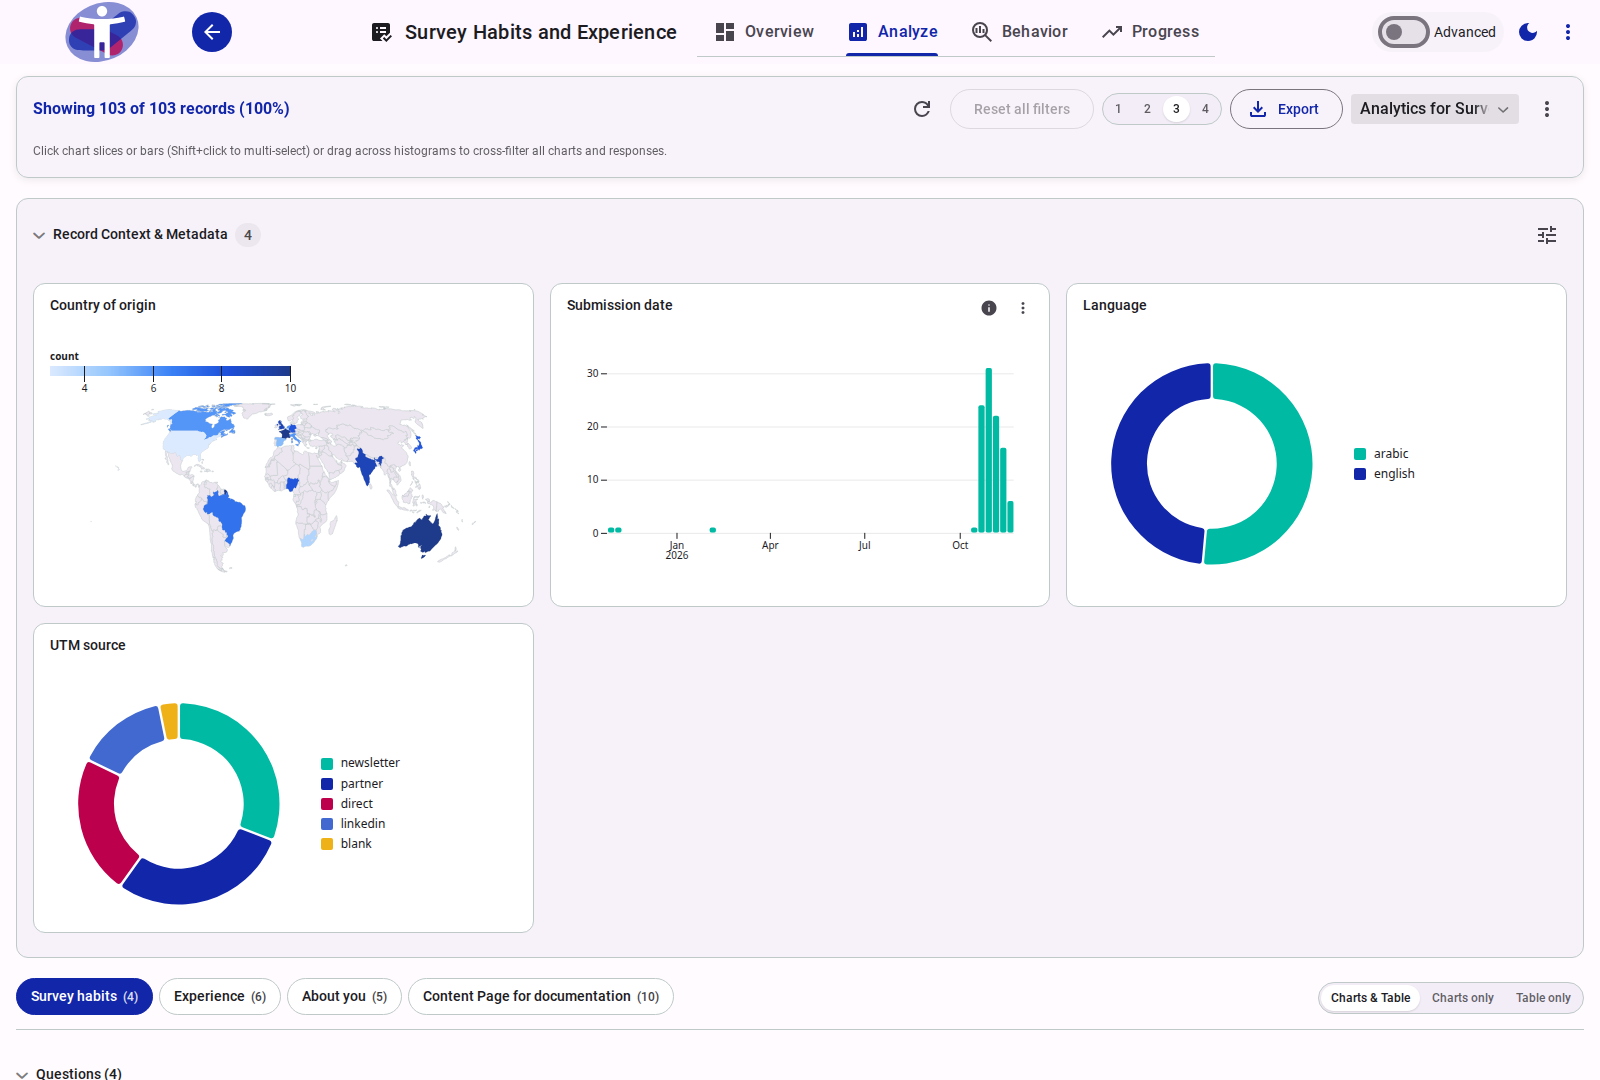
1. Opening Survey Analytics
To access survey analytics:
- Open your survey in the management console.
- Select the Analyze tab in the top navigation bar.
- By default, the analytics workbench opens on the Overview sub-tab showing responses for your survey's active batch.
The header summary bar indicates how many records are loaded for the current batch, how many match the active filters (for example Showing 103 of 103 records (100%)), and adds an active filter badge when filters are applied. Use Reset all filters to restore the full dataset and the refresh icon to reload it.

TIP
If your survey uses multiple distribution batches, switch between batches in the Share settings to focus your analysis on specific respondent waves.
2. Viewing Record Context and Metadata
The top section of the workbench displays Record Context & Metadata charts. These cards visualize survey paradata that is independent of specific question responses:
- Submission date: Response arrival frequency over time.
- Language: Distribution of locales selected by respondents.
- Country of origin: Geographic distribution derived from respondent connection metadata.
- UTM source: Marketing and distribution campaign identifiers.
- Accessibility & display preferences: Theme, color mode, font size, and touch input usage.
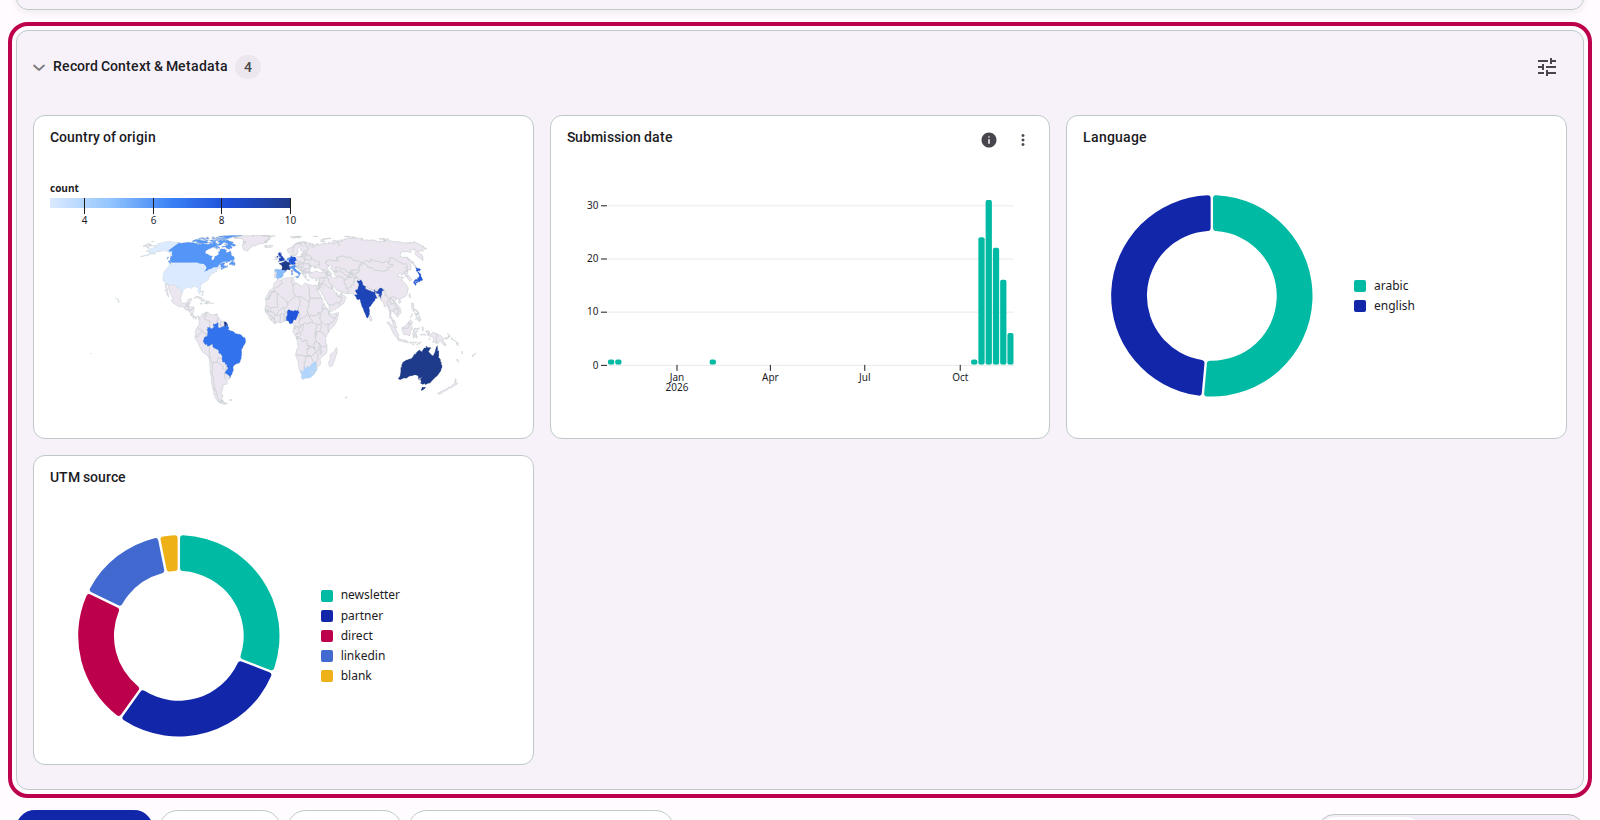
Persistent Top Band
Metadata charts remain pinned in the top band as you navigate between different survey pages, allowing you to filter by demographic or environment variables without losing context.
Customizing Visible Metadata Charts
To change which metadata cards appear in the top band:
- Click the settings gear icon in the Record Context & Metadata header.
- In the modal dialog, select or unselect metadata fields (e.g. toggle Touchscreen, Theme, or UTM Source).
- Use the up and down arrow buttons next to each field to reorder the cards.
- Click Close. Your chosen metadata order is saved with your current Analytics View.
3. Navigating Survey Pages and Question Cards
Survey questions are organized under the Pages tab bar beneath the metadata band:
- Select any page tab (e.g. Survey habits, Experience, About you, Content Page) to view the question cards belonging to that page.

- Within a page, questions are grouped into collapsible sections matching your survey composition. Click any section header to collapse or expand its question cards.
- Each question card displays the question text, response distribution chart, and sample size (n).
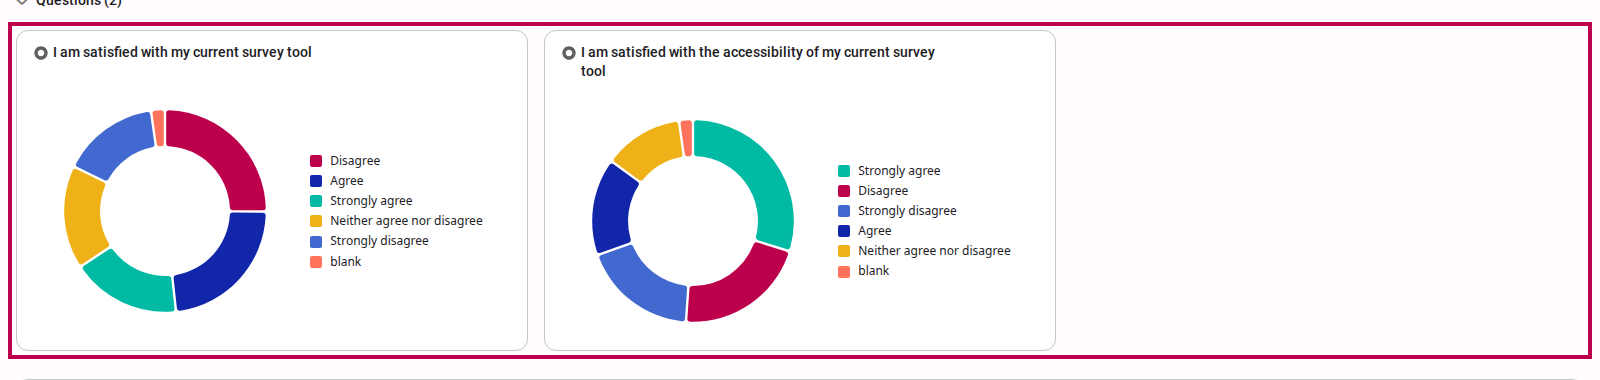
Question cards automatically select the optimal chart representation based on the question type:
- Single-choice questions: Donut charts or horizontal bar charts showing category proportions.
- Multiple-choice questions: Horizontal bar charts displaying multi-select frequency.
- Numeric, rating, and Likert scales: Histograms displaying continuous distributions and bin counts.
A question-type icon sits before each card title (single-choice, multiple-choice, rating, ranking, numeric, date, yes/no, map, or text). Hover the icon to read its label, or the info icon beside the card menu to read the question description.
4. Interactive Cross-Filtering
Every chart element functions as a live filter. You can isolate any cohort across the entire survey with a single click:
- Click any chart mark (a slice of a donut chart, a bar, or a histogram bin).
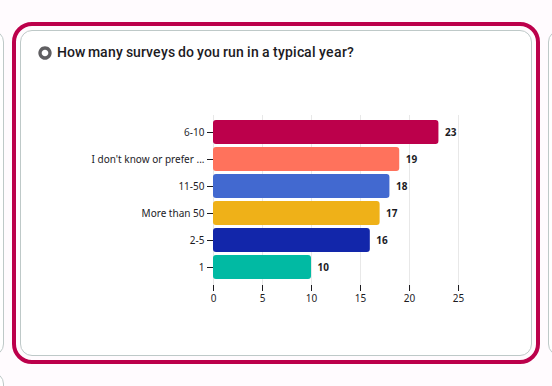
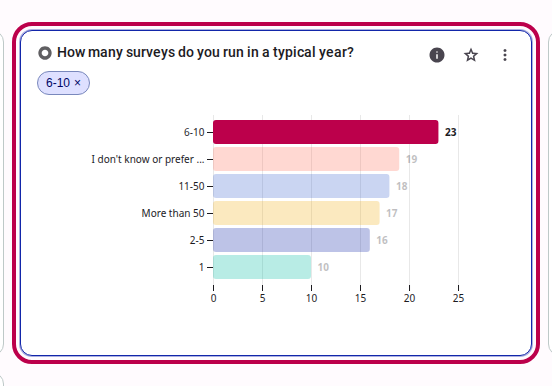
- The selected mark highlights, and every other chart across all pages immediately recalculates to display only responses matching that criterion.
- The summary toolbar updates instantly, displaying the count and percentage of matching respondents (e.g.
10 / 103 (10%)), accompanied by an active filter chip.

- All other charts in the workbench reflect the filtered distribution:
Combining Multiple Filters
You can click additional chart marks across different questions or metadata fields to narrow your cohort further (e.g. Language: English AND Device: Touchscreen AND Answer: Yes). All active filter chips appear sequentially in the toolbar.
Clearing Filters
To reset filters:
- Click the × (remove) icon on any individual filter chip to drop that specific filter.
- Click the highlighted slice or bar on the originating chart to toggle the filter off.
- Click Reset all filters in the toolbar to restore the entire dataset.
5. Inspecting Individual Responses
Below the question cards, the Responses table lists all individual submissions matching the active filters:
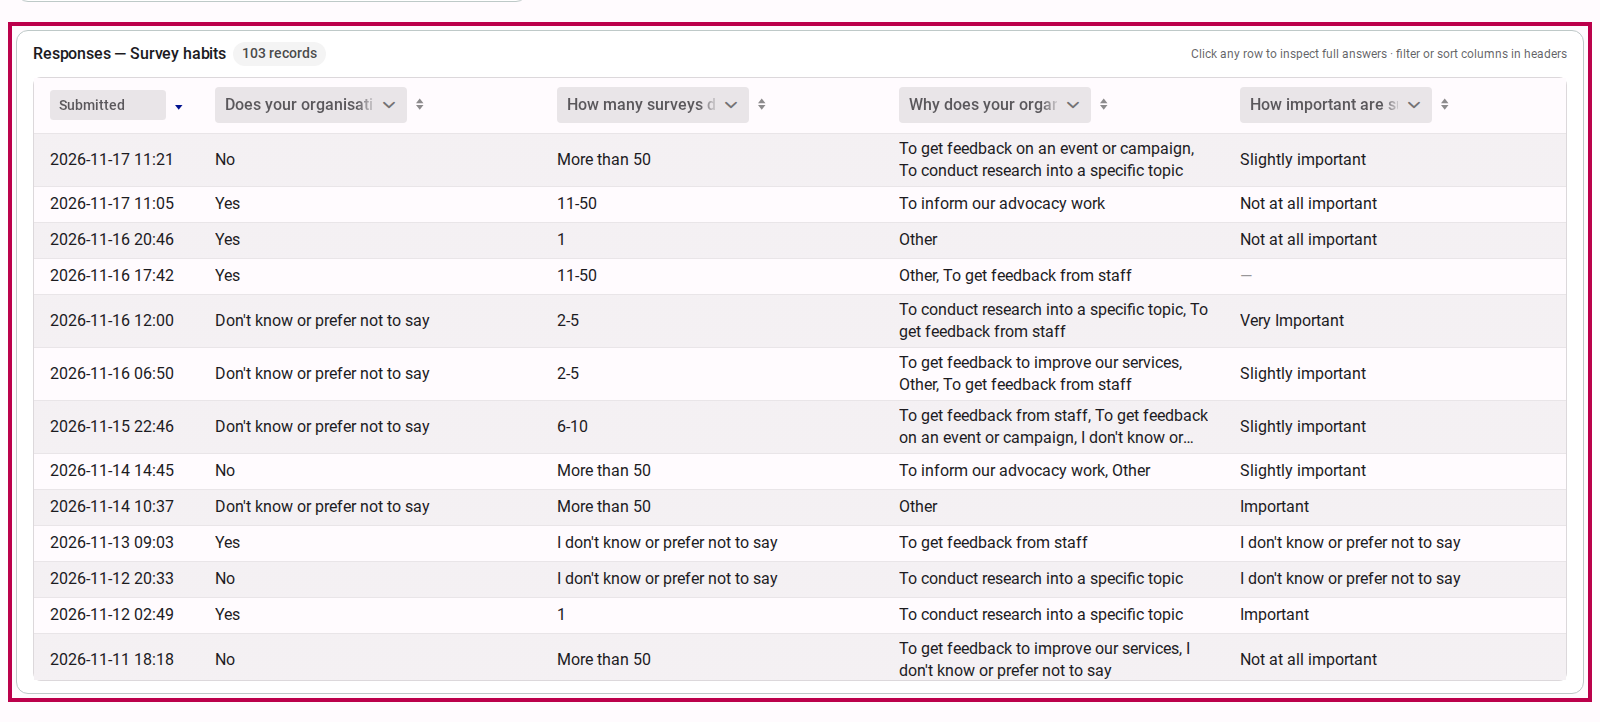
To drill down into full answers:
- Click any row in the responses table.
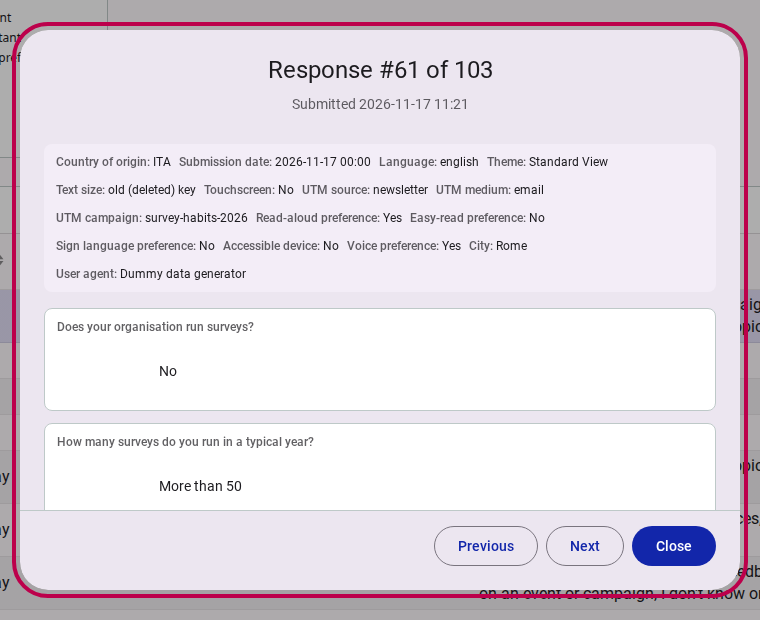
- The Response Inspector dialog opens, displaying the complete answers submitted by that respondent.
- Use the pagination controls to step through matching respondent submissions one by one.
Response IDs and removing responses (advanced mode)
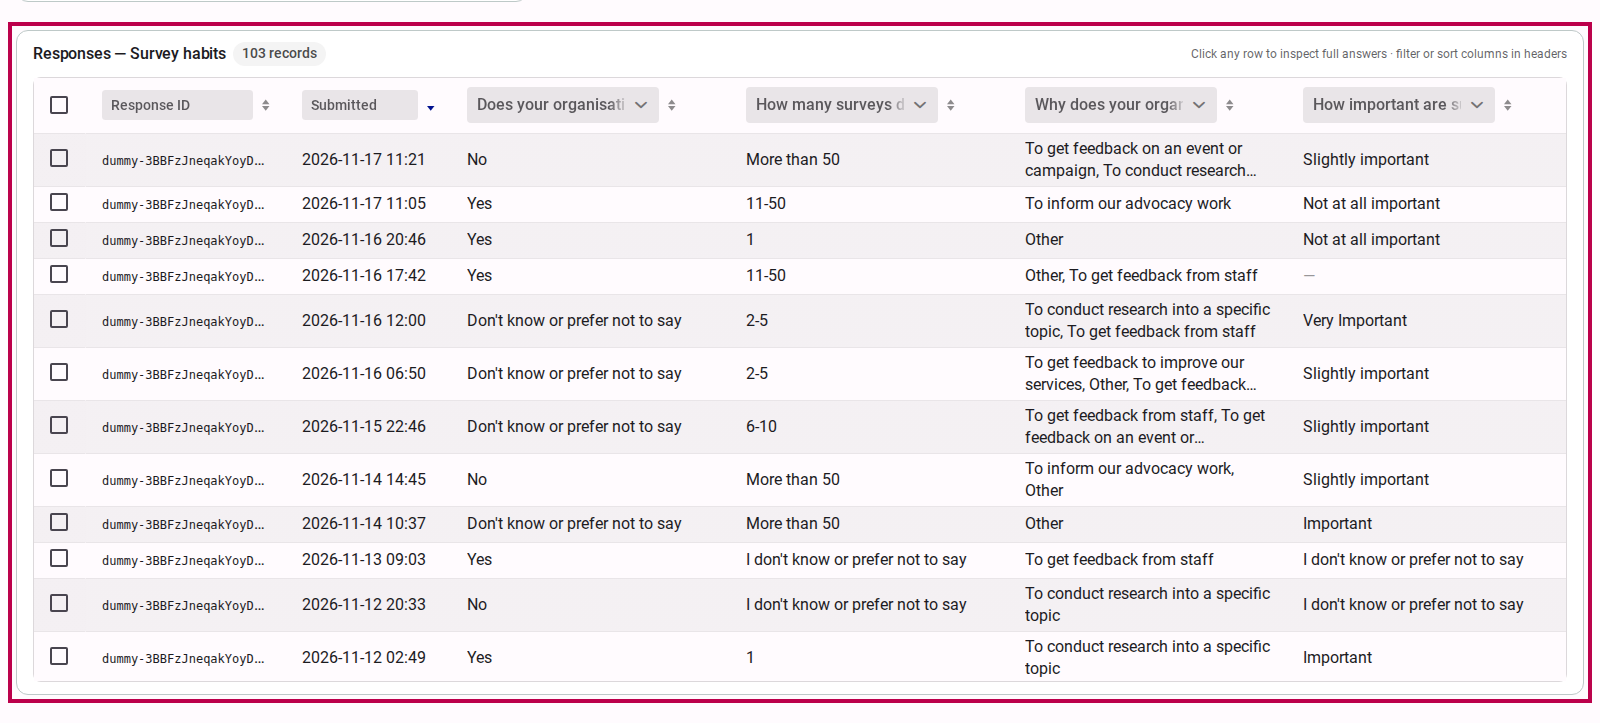
Turn on Advanced in the top toolbar to audit individual records in the responses table:
- A Response ID column appears (filterable and sortable), showing the stored record identifier used by the Progress tab and the compliance archive.
- Each row gains a checkbox for editors with edit rights. Select one or more responses, or use the header checkbox to select every row visible under the current filters. The header then shows N selected and a Remove from dataset… button:
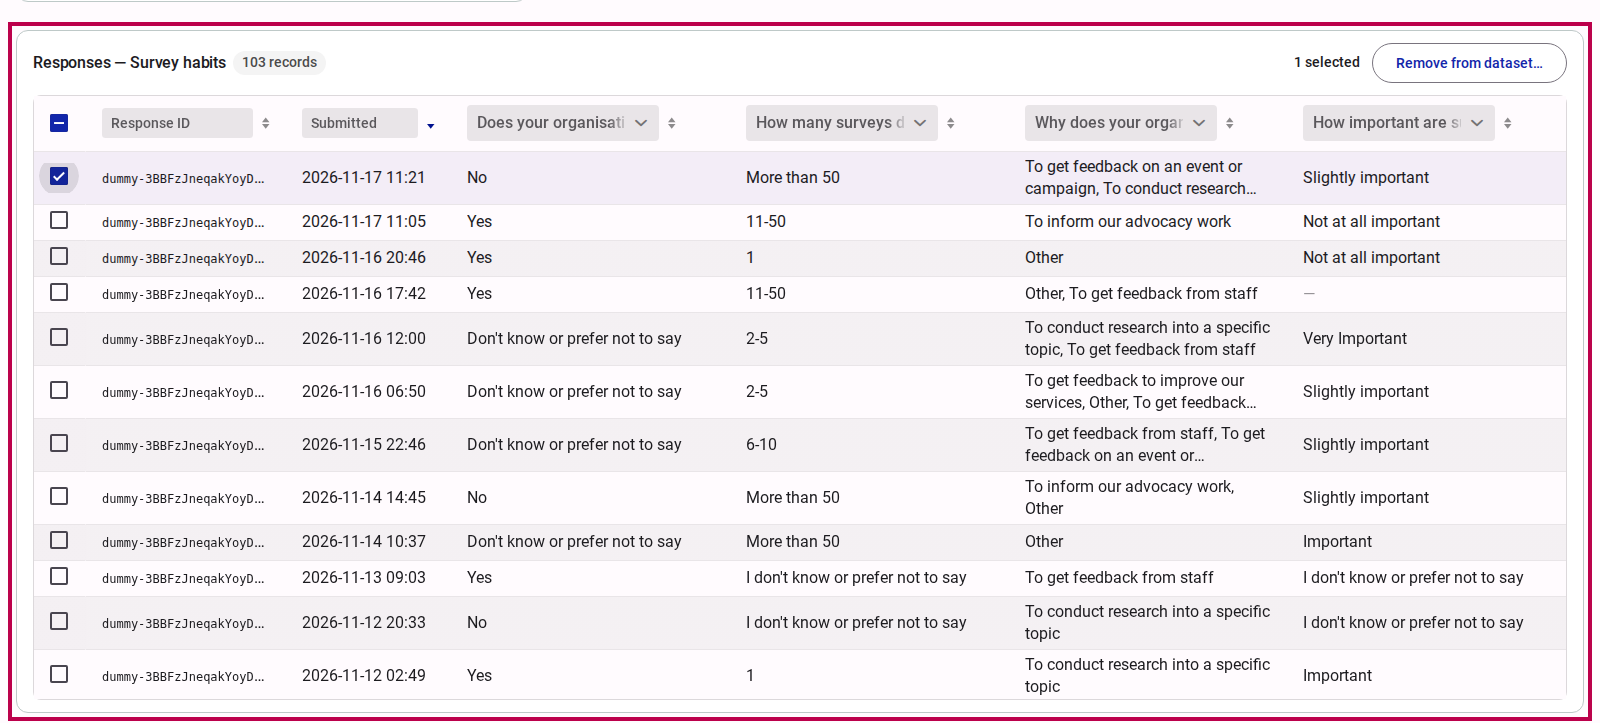
- Click Remove from dataset… to open the removal dialog.
- Choose a reason — Test data or Other — and add a note when you pick Other (the note is required for that reason).
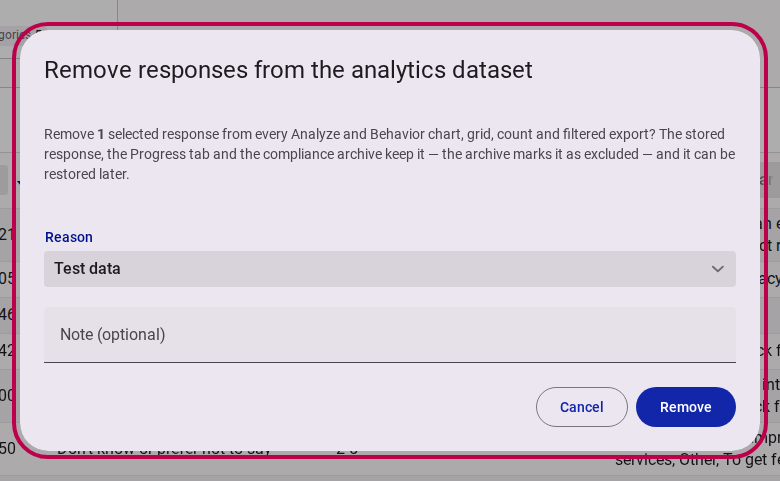
Click Remove. Removed responses are immediately excluded from all survey charts, respondent counts, response tables, and filtered browser exports across the entire survey.
Audit Preservation & Restoration
Exclusion is auditable and non-destructive: the original response remains safely preserved in the database and compliance archive. To review or restore excluded responses, use the Excluded (N) manager on the Behavior tab (see Excluding and Restoring Responses and Response Exclusion Reference).
6. Pinning Key Charts to the Top Band
When comparing question responses against key demographic or outcome variables across different pages, pin the primary charts to the top band:
- Locate the question card you want to keep visible (e.g. an overall satisfaction or primary outcome question).
- Hover over the card to reveal the actions and click the Star (pin) button.

- The card immediately moves into the Pinned Charts band situated above the survey page tabs.
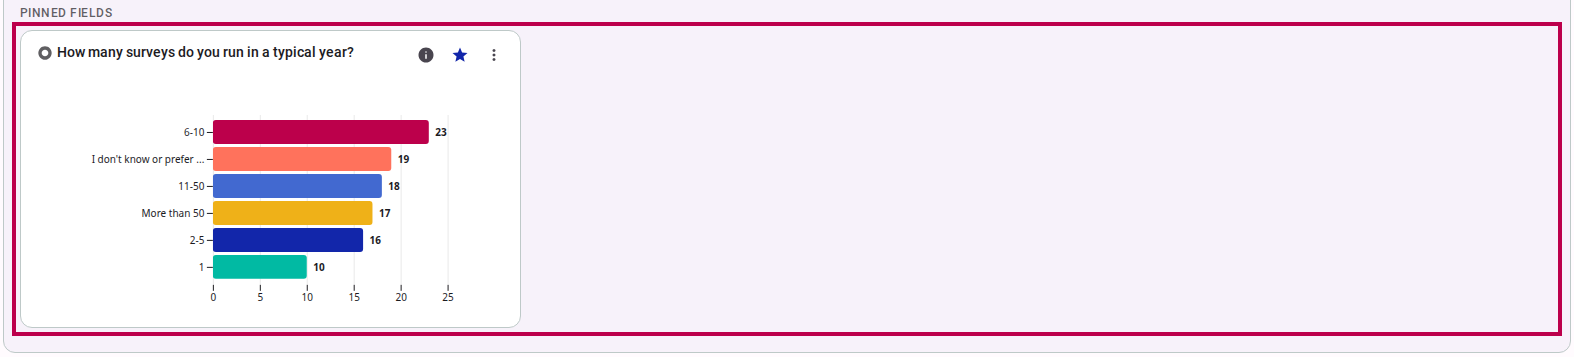
- As you switch page tabs, the pinned chart remains accessible for continuous cross-filtering.
- To unpin a chart, hover over the pinned card and click the star icon again.
7. Customizing Card Display and Exporting Charts
Every card features a context menu for visual customization and presentation export:
- Hover over any question or metadata card and click the Options menu button (three vertical dots).
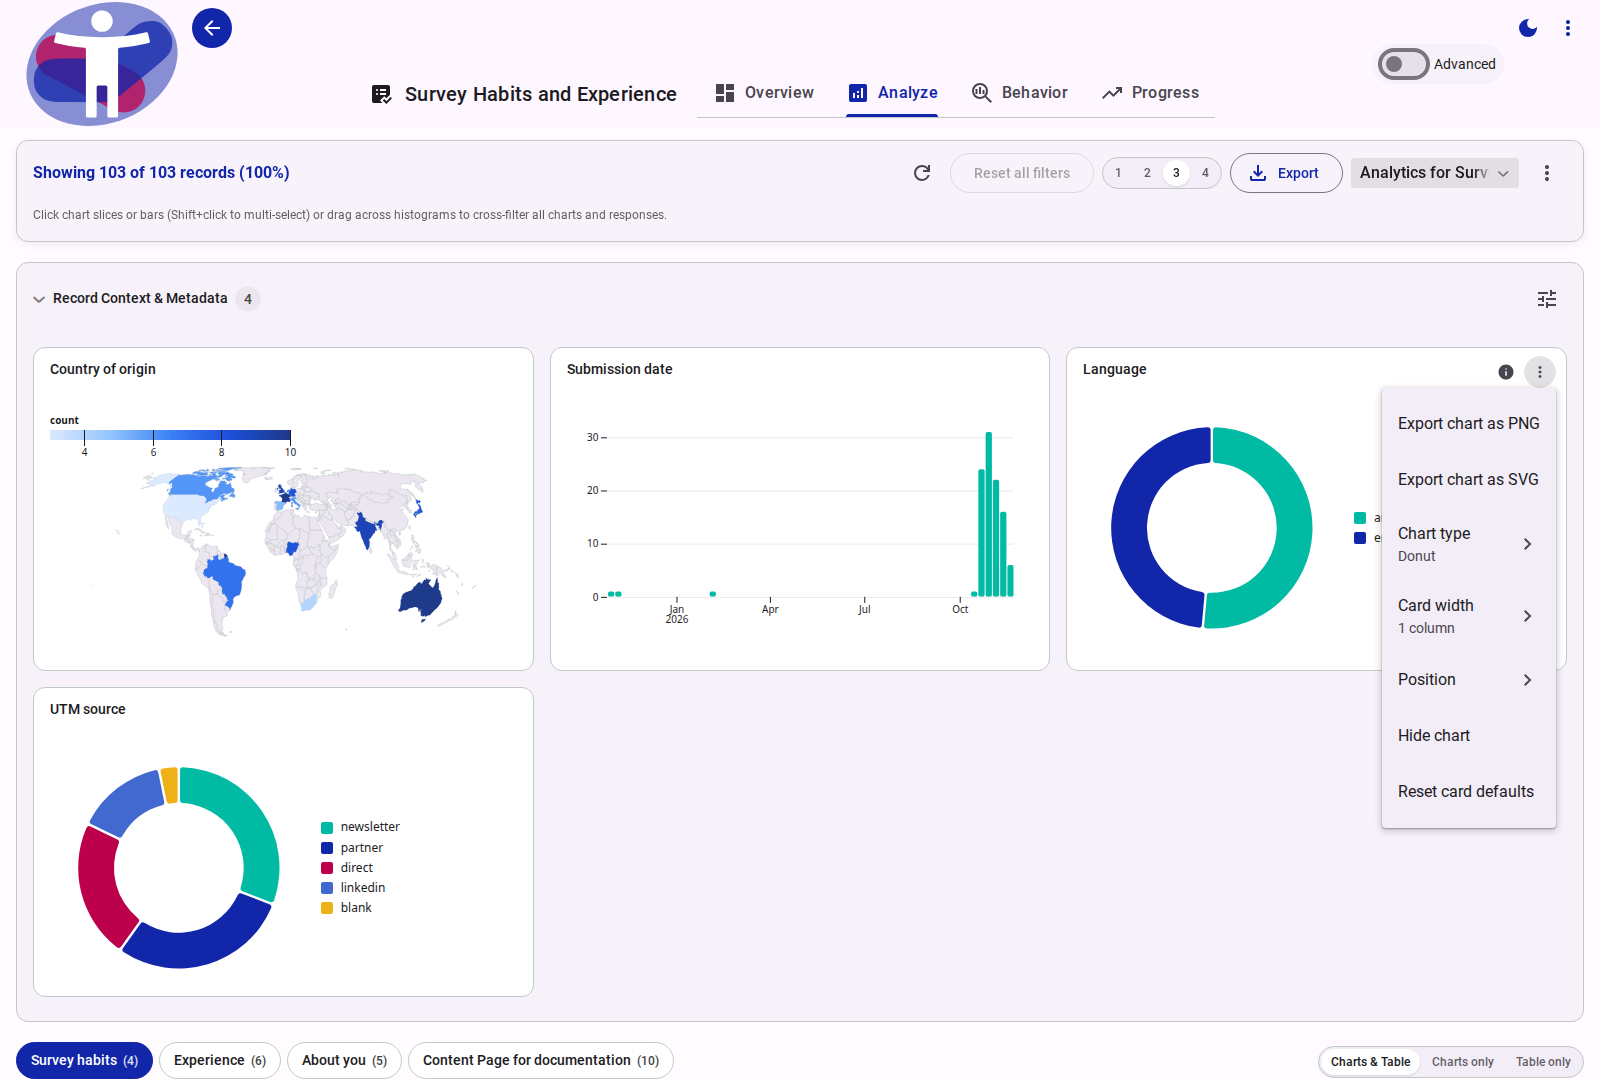
- Choose from the available options:
- Export chart as PNG: Downloads a high-resolution raster image suitable for slide decks, reports, or documents.
- Export chart as SVG: Downloads a vector graphic file that preserves crisp typography and scalability at any print or digital resolution.
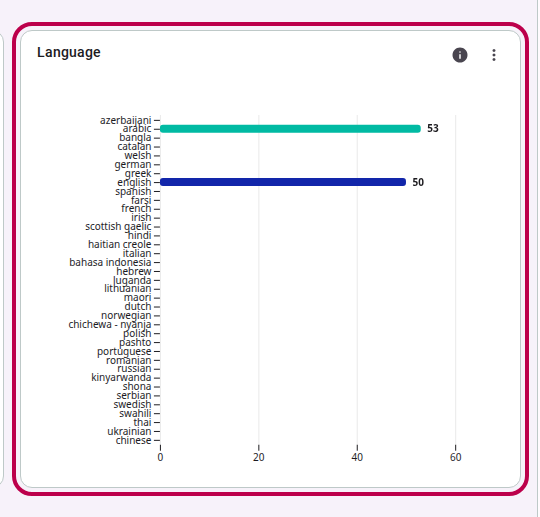
- Chart type: Toggle between Donut and Horizontal bar for choice questions. Bar charts are especially helpful for questions with longer label text.
- Card width: Adjust the card's column span between 1 column, 2 columns, or Full width to emphasize complex questions.
- Position: Move the card earlier or later in the section sequence.
- Hide chart: Remove the card from the current page. Restore hidden cards from the Hidden (N) button in the toolbar.
- Reset card defaults: Revert the card's width and chart representation to system defaults.
8. Adjusting Grid Density
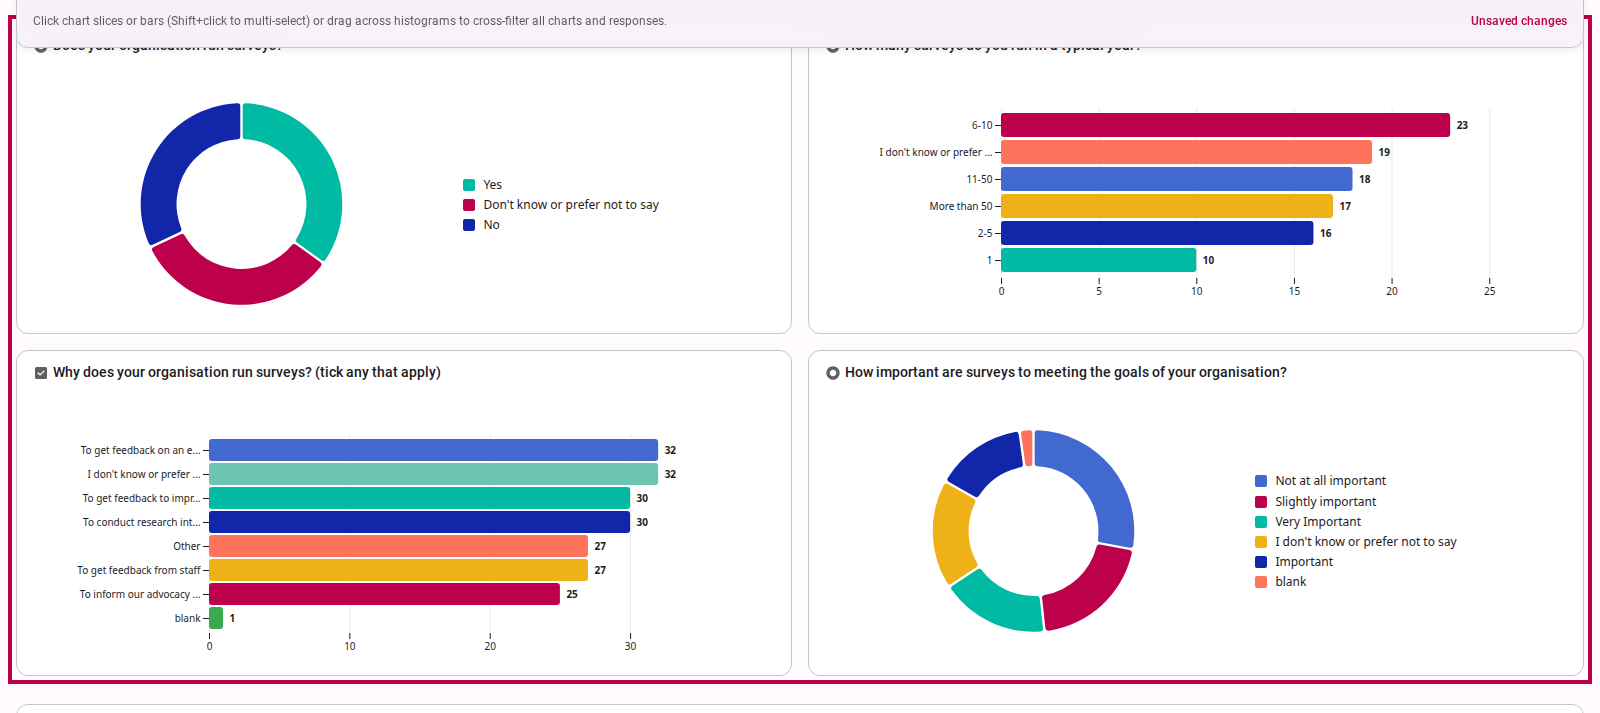
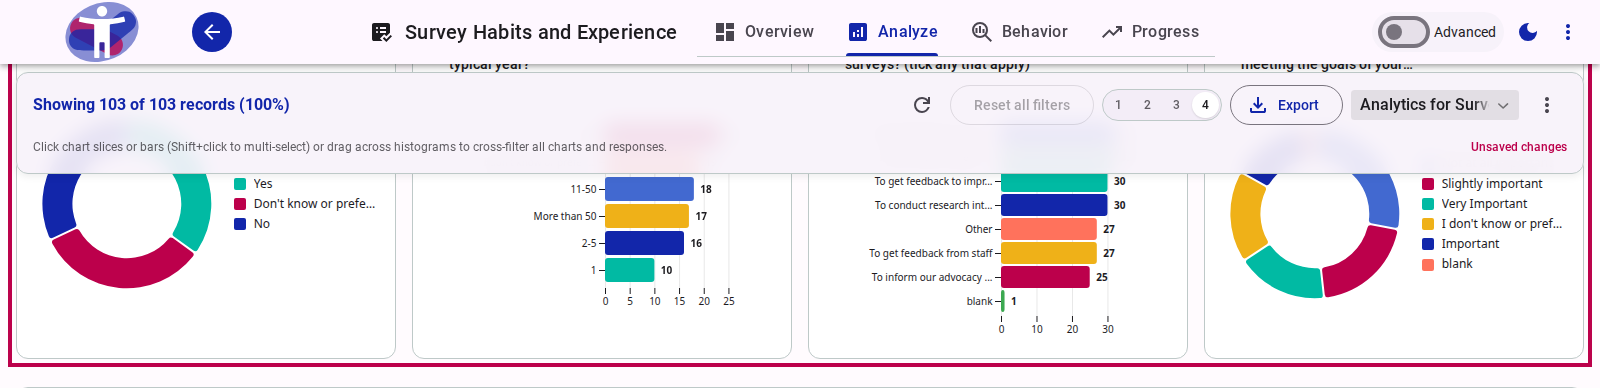
You can adapt the workbench layout to your monitor size and analytical focus using the column switcher in the top toolbar:
- 1 column: Linear, single-column stream ideal for narrow viewports or full-width detailed review.
- 2 columns: Balanced layout offering generous width for answer labels and bar lengths.
- 3 columns: Default balanced layout for standard desktop monitors.
- 4 columns: High-density dashboard view displaying maximum cards on wide displays.
9. Managing Analytics Views and Sorting Charts
Creating and Switching Views
Analytics Views allow you to preserve distinct analytical perspectives (e.g. "Accessibility Cohort", "Regional Comparison", "Executive Overview") without overwriting the default configuration:
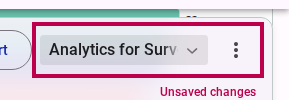
- Click the view selector dropdown in the top toolbar to switch between saved views.
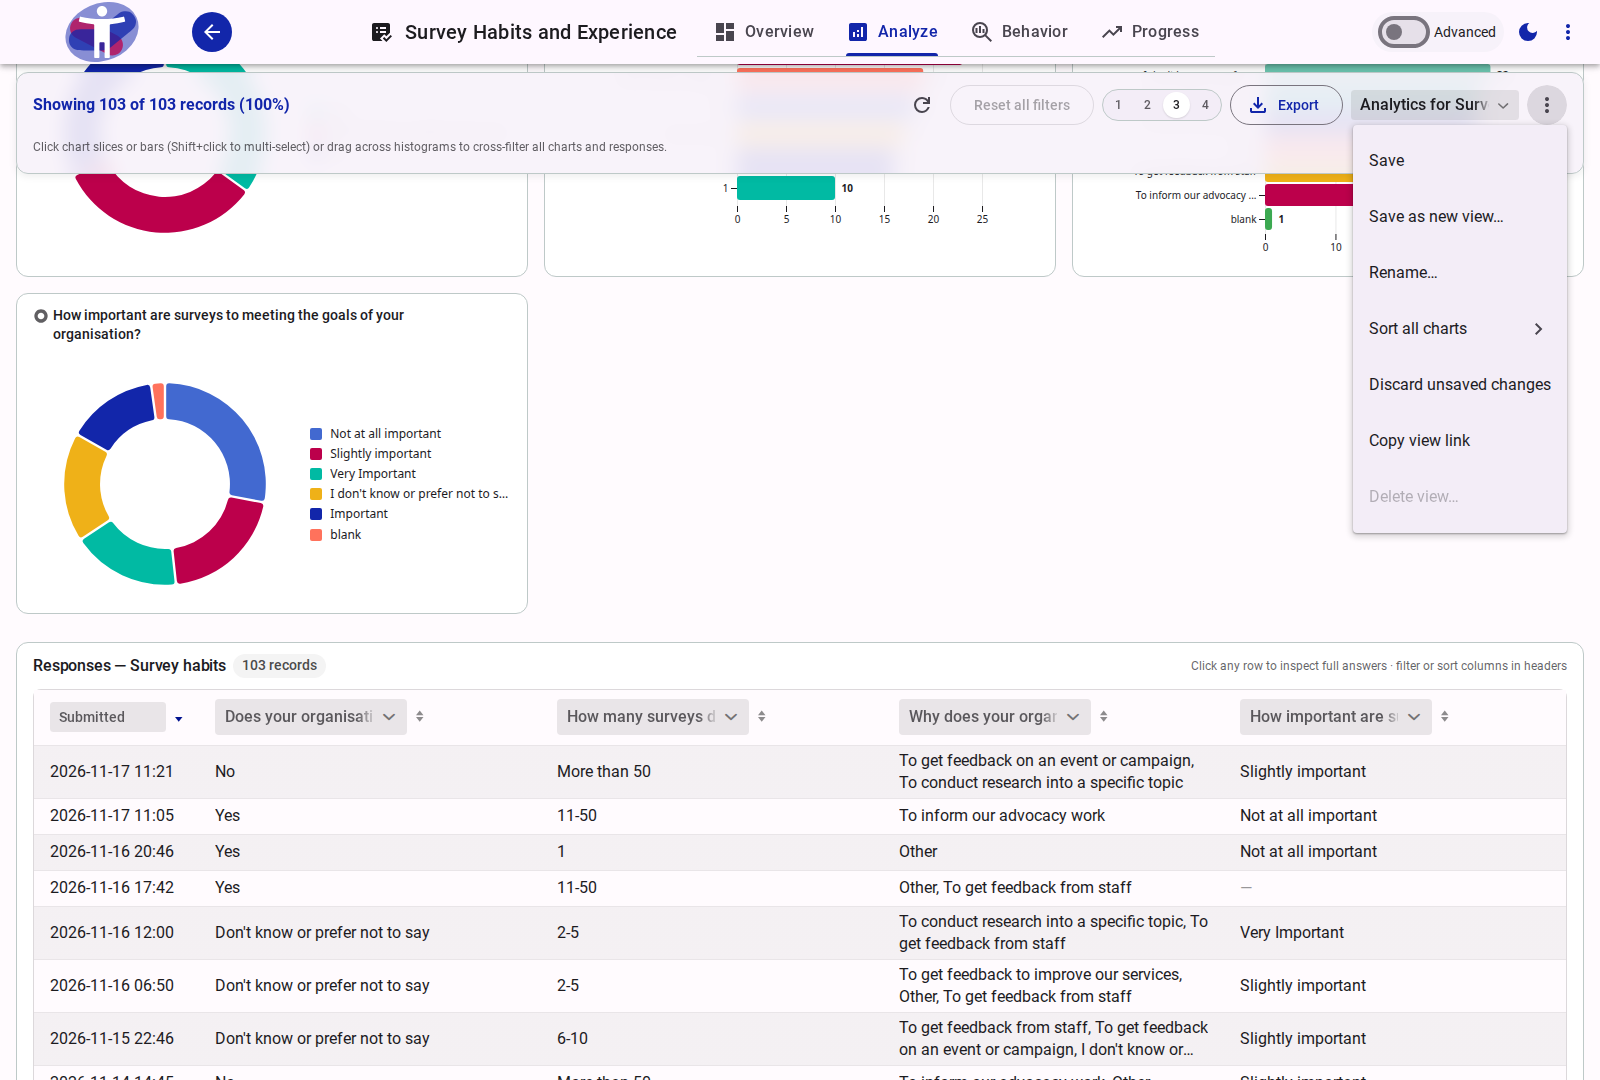
- Click the View actions menu (three dots beside the view selector) to manage views:
- Save: Persist current filter settings, pinned charts, column widths, and metadata order to the active view.
- Save as new view…: Create a named snapshot with current filters and layout.
- Rename…: Change the name of the active view.
- Discard unsaved changes: Revert modifications made since the last save.
- Copy view link: Share a direct link with collaborators that opens the survey directly into this view configuration.
- Delete view…: Permanently remove a custom view (the default view cannot be deleted).
Sorting All Charts
To reorganize chart categories consistently across the entire survey:
- Open the View actions menu in the toolbar.
- Hover over or click Sort all charts.
- Select a sort order:
- Survey order: Preserves the original option order defined during survey authoring.
- Largest first: Orders categories in descending frequency so top answers appear first.
- Smallest first: Orders categories in ascending frequency to spotlight niche or underrepresented options.
10. Advanced Statistical Indicators
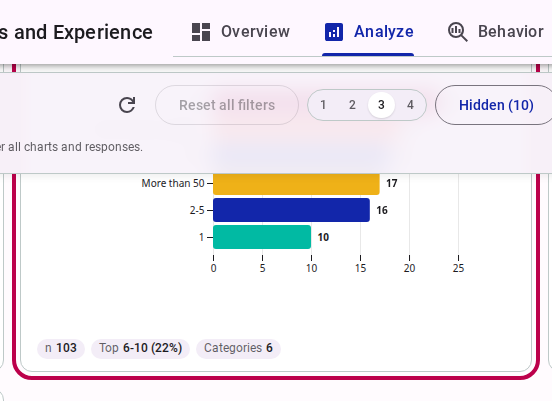
Toggle on Advanced in the top toolbar to display a live statistical summary strip below every question card. The strip dynamically recalculates against the active cross-filters:
- Universal: Sample size (n) and Missing count with percentage share.
- Numeric & Ratings: Mean, SD (standard deviation), Median, IQR (interquartile range), and Range (min–max).
- Categorical & Multiple-Choice: Top response with percentage share, and total Categories observed.
- Rankings & Dates: Top #1 choice, Mean rank, and date Span.
See Statistical Indicators Reference for complete mathematical definitions, sample-size formulas, and aggregation rules.
Cards hidden via Hide chart in their options menu can be reviewed and reinstated using the Hidden (N) menu in the toolbar:
11. Exporting the Filtered Dataset
The workbench allows downloading the active analytical view or generating an archive for external analysis:
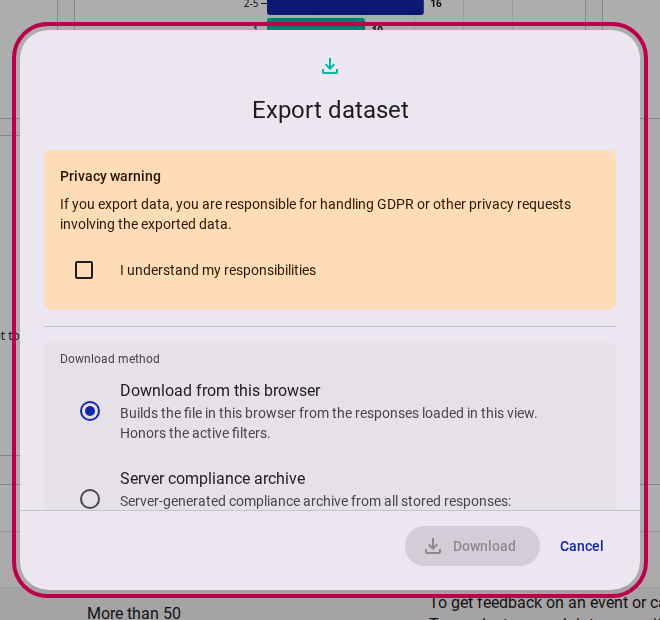
- Click the Export button in the analytics toolbar.
- Read the data privacy notice and tick I understand my responsibilities.
- Choose the export workflow:
- Download from this browser: Immediately compiles and downloads the responses matching your active cross-filters in CSV or JSON.
- Server compliance archive: Generates an exhaustive server archive covering all stored records (anonymized, humanized, or raw).
Full Export Guide
For complete instructions on column selection, raw codes vs. humanized labels, multi-value separators, and server compliance archives, see How to Export Survey Data.
Related Content
- How to Analyze Respondent Behavior and Data Quality: Inspect timing paradata, quality signals, drop-offs, and exclude low-effort responses.
- How to Export Survey Data: Export the filtered dataset or the full server compliance archive in CSV or JSON.
- Survey Analytics Workbench Reference: Complete specifications for UI controls, card parameters, view schemas, and statistical formulas.
- Behavioral Analytics Reference: Algorithmic rules, scoring rubrics, and formulas for behavioral metrics.
- Understanding Respondent Behavior and Data Quality: Conceptual background on satisficing, paradata, response latency, and survey methodology literature.