
How to Analyze Respondent Behavior and Data Quality
INFO
Behavioral Analytics uses client-side paradata (interaction timing, answer revisions, paste bursts, and tab focus) to assess data quality and survey UX friction. Researchers can identify confusing questions, detect low-effort submissions, and audit or exclude problematic responses without compromising privacy.
Before you begin: enable behavioral tracking
The Behavior tab only has data for surveys that enabled tracking before respondents took them. Turn it on once per survey:
- Open the survey and switch on Advanced Mode.
- Open Share → Behavioral Tracking.
- Turn on Activate Behavioral Tracking.
- To analyze abandonment as well as completed sessions, turn on Monitor Drop Off. This also turns tracking on; turning tracking off turns drop-off monitoring off.
- Publish the survey.
Tracking applies to sessions that start after it is enabled. If the Behavior tab is empty, check this setting first — and note that behavioral tracking is available on some plans only. See Behavioral Tracking Reference for what is recorded and the plan limitation.
1. Opening the Behavioral Analytics View
To access behavioral analytics:
- Open your survey in the management console and click the Analyze tab in the main navigation.
- In the secondary sub-navigation, click Behavior.
- The dashboard loads behavioral paradata gathered from respondents during their survey sessions.

Privacy and Ethical Tracking
Behavioral analytics is non-invasive: the platform does not log keystrokes, record screen video, or capture biometric data. It measures event timings (active vs. idle duration, tab focus changes, choice revisions, and paste events) to evaluate aggregate survey health and question quality while respecting respondent privacy.
2. Reading the Behavioral KPI Summary Strip
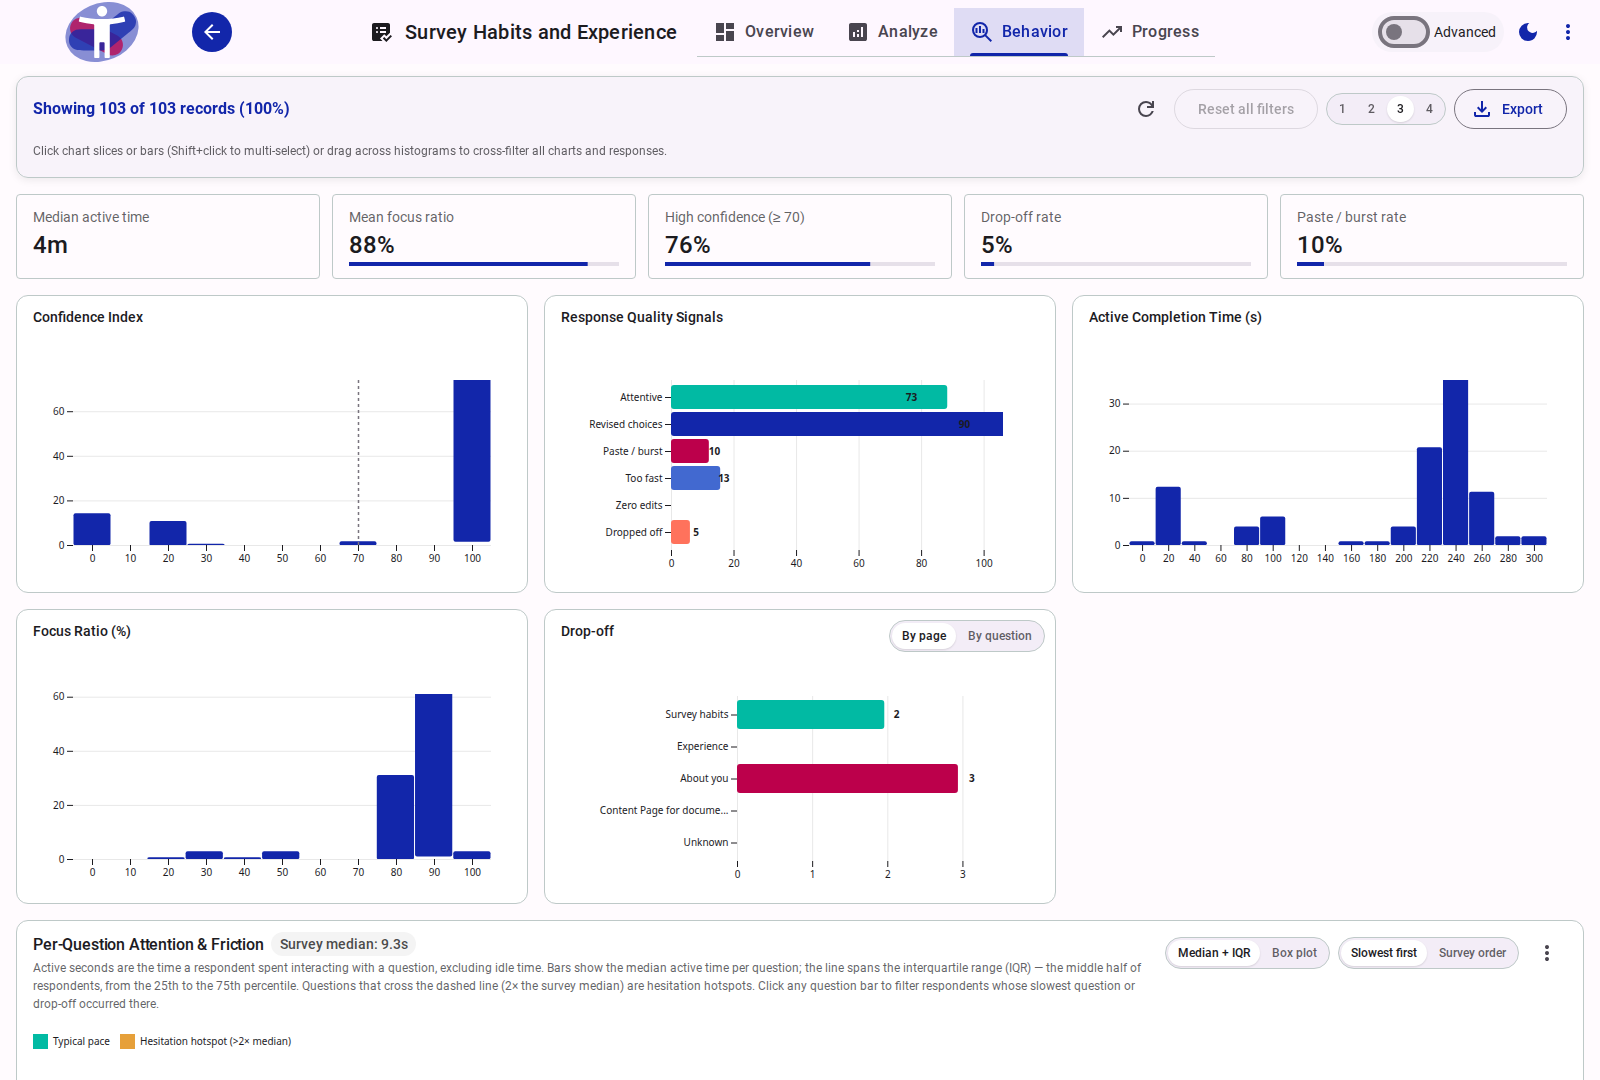
The top KPI strip provides a high-level summary of survey engagement and data integrity:

- Median active time: The typical time respondents spend actively interacting with questions (excluding idle time when the browser is inactive).
- Mean focus ratio: The average share of session time respondents were actively focused on the survey tab.
- High confidence (≥ 70): The percentage of scored responses whose Confidence Index is 70 or higher.
- Drop-off rate: The percentage of started sessions that were discontinued before completion.
- Paste / burst rate: The proportion of tracked responses where long text answers were pasted or entered in single high-velocity bursts.
Hover, focus, or tap the info icon in the corner of each tile to read what the metric measures.

3. Assessing Data Quality: Confidence Index and Quality Signals
The dashboard evaluates submission authenticity through two interactive visual charts:
Confidence Index Distribution
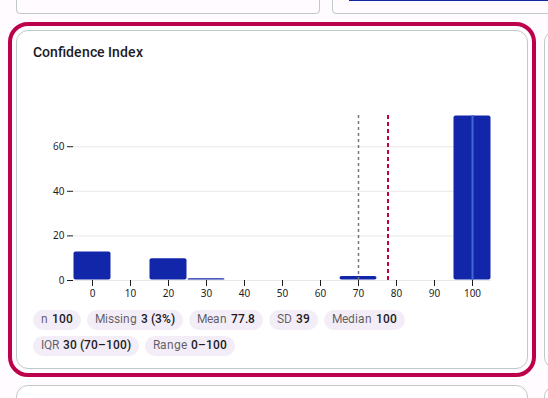
The Confidence Index card displays a score histogram (from 0 to 100) classifying responses based on behavioral engagement:
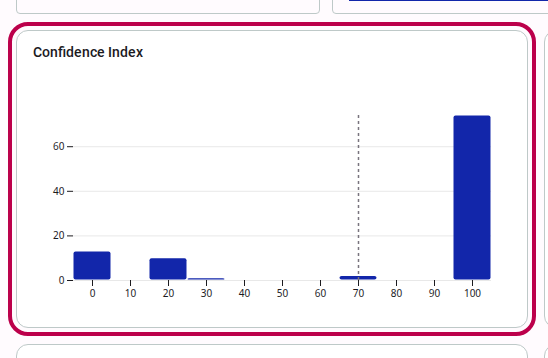
- High Confidence (≥ 70): Indicates steady reading dwell times, high focus ratios, and deliberate interaction.
- Low Confidence (< 50): Highlights responses exhibiting rapid click-through speeding, high idle gaps, or paste bursts.
Rubric and Theory
For the exact mathematical penalties and heuristic scoring formulas, see Confidence Index Scoring Rubric. For the scientific foundation and satisficing research, see Understanding Respondent Behavior and Data Quality.
Quality Signals Breakdown
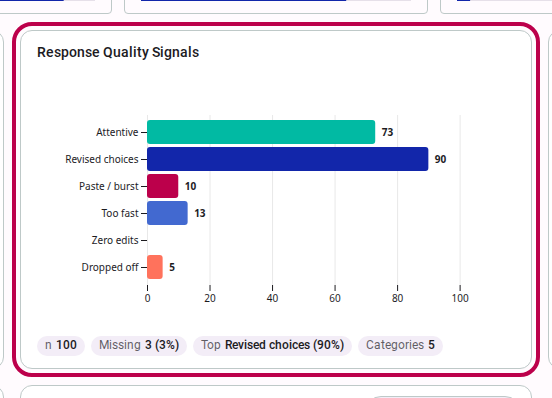
The Quality Signals chart categorizes responses into behavioral indicator flags:
- Attentive: Complete sessions meeting human reading dwell thresholds.
- Revised choices: Respondents who altered their initial choice selection, indicating deliberation.
- Paste / burst: Instantaneous text entry flagging copy-pasting or automated script injection.
- Too fast: Submissions completed faster than human reading limits allow (speeders).
- Zero edits: Direct single-pass submissions without revisions.
- Dropped off: Abandoned partial sessions.
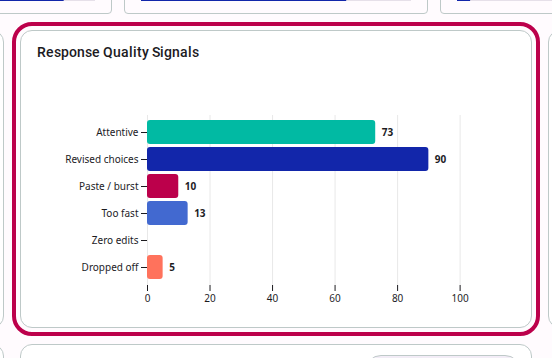
Clicking any score bucket or signal bar immediately filters the entire dashboard to that respondent cohort.
4. Diagnosing Drop-Off Points
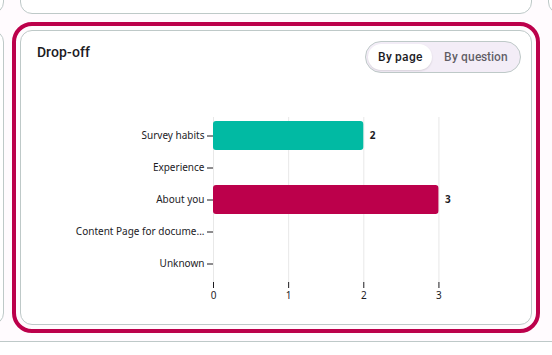
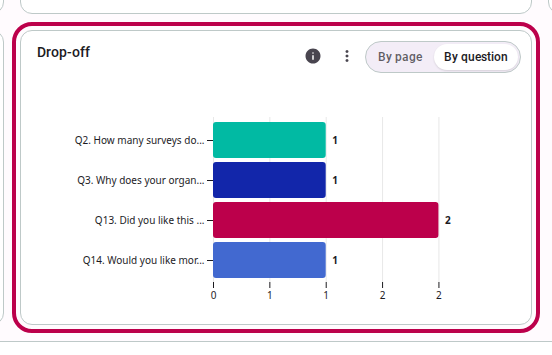
When respondents abandon a survey, identifying the exact exit location is critical for UX improvement. Use the segmented toggle above the drop-off card to switch between analysis levels:
Drop-Off by Page
Identifies the overall survey section or page where abandonment occurred:
Drop-Off by Question
Pinpoints the exact question where respondents halted their participation:
Remediation Strategy
If a specific question exhibits a drop-off spike, consider whether it asks for sensitive information, contains confusing instructions, or is excessively long.
5. Per-Question Attention and Cognitive Friction
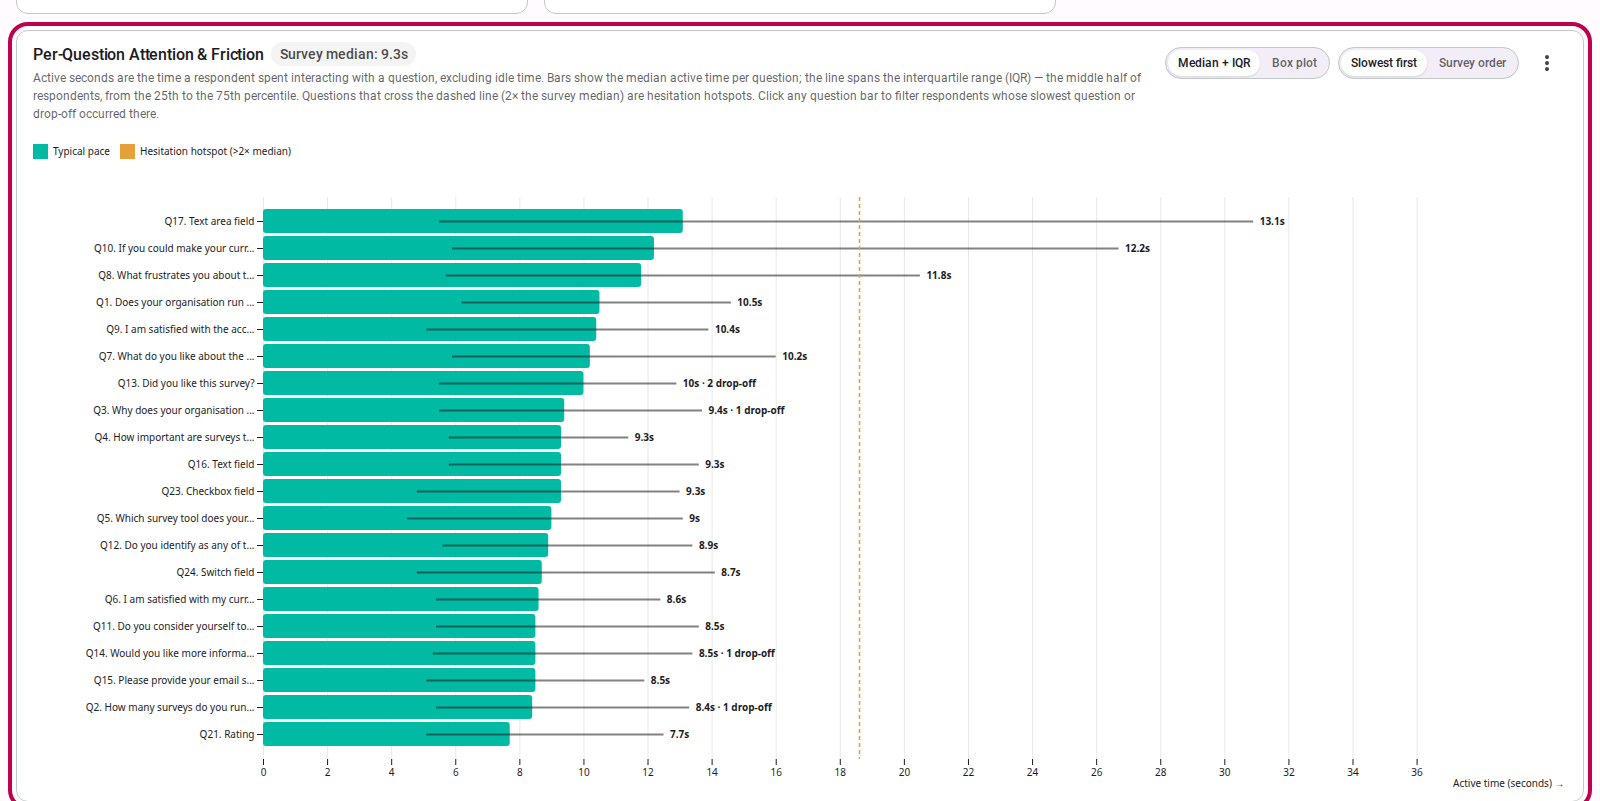
The Per-Question Attention & Friction card analyzes response latency across every question to detect cognitive stumbling blocks:
Median Duration Mode
Displays the median dwell time per question against the overall survey median:
- Questions with dwell times at least twice the survey median are automatically flagged as Hesitation Hotspots.
- Hotspots indicate questions requiring disproportionate cognitive effort, complex phrasing, or confusing layout.
Boxplot Mode
Use the Median + IQR / Box plot toggle in the card header and select Box plot to visualize dispersion:
- Displays the median, the interquartile range (IQR, from the first quartile to the third quartile), and minimum/maximum whiskers.
- Reveals answer latency spread and distribution skewness, helping distinguish questions that trouble all respondents from questions that only confuse a subset.
- Dots beyond the whiskers are outliers.
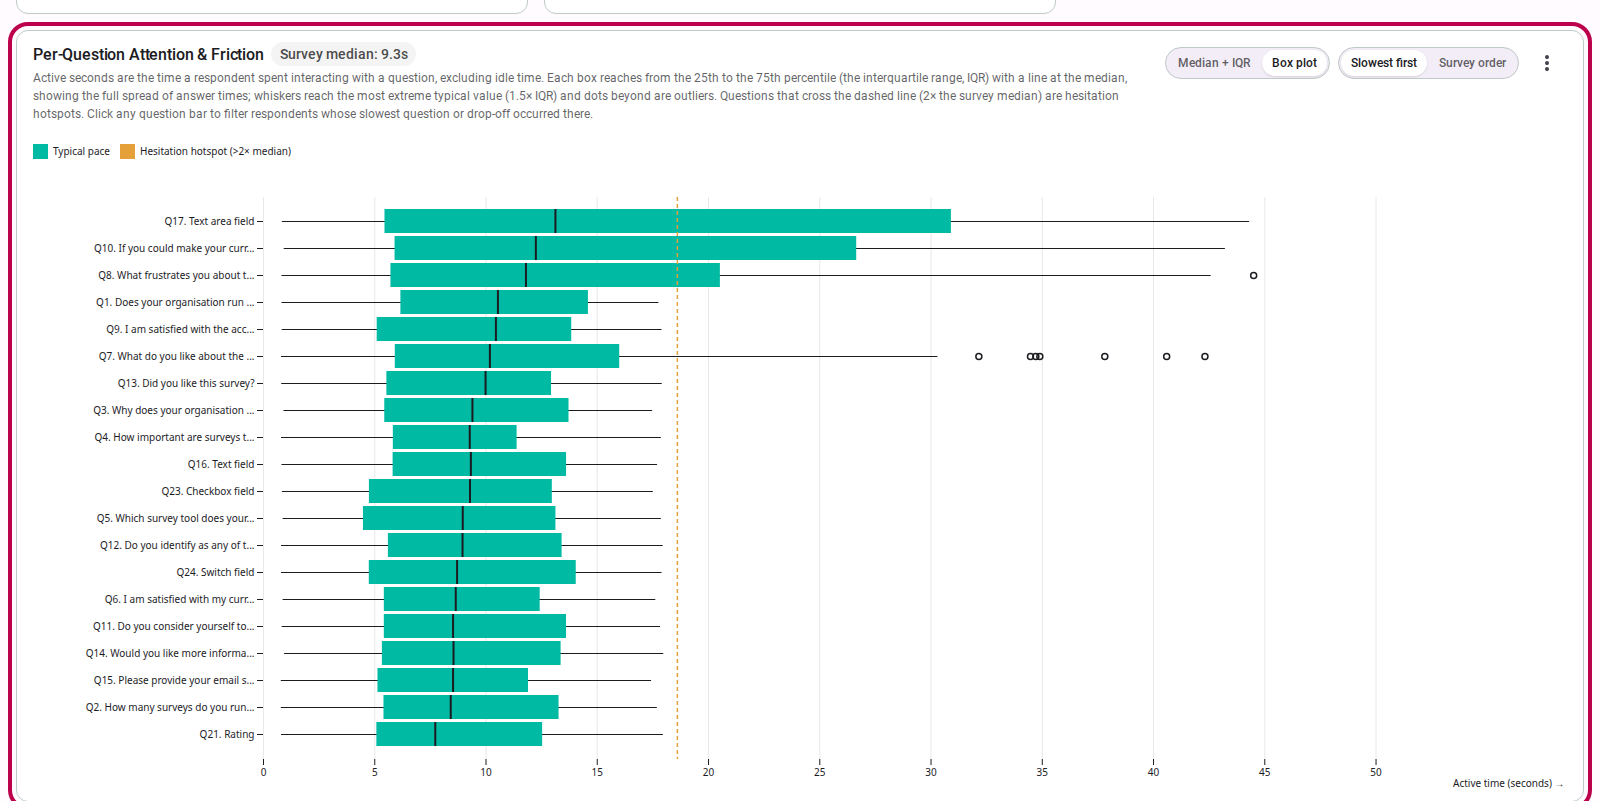
Chart Options and Export
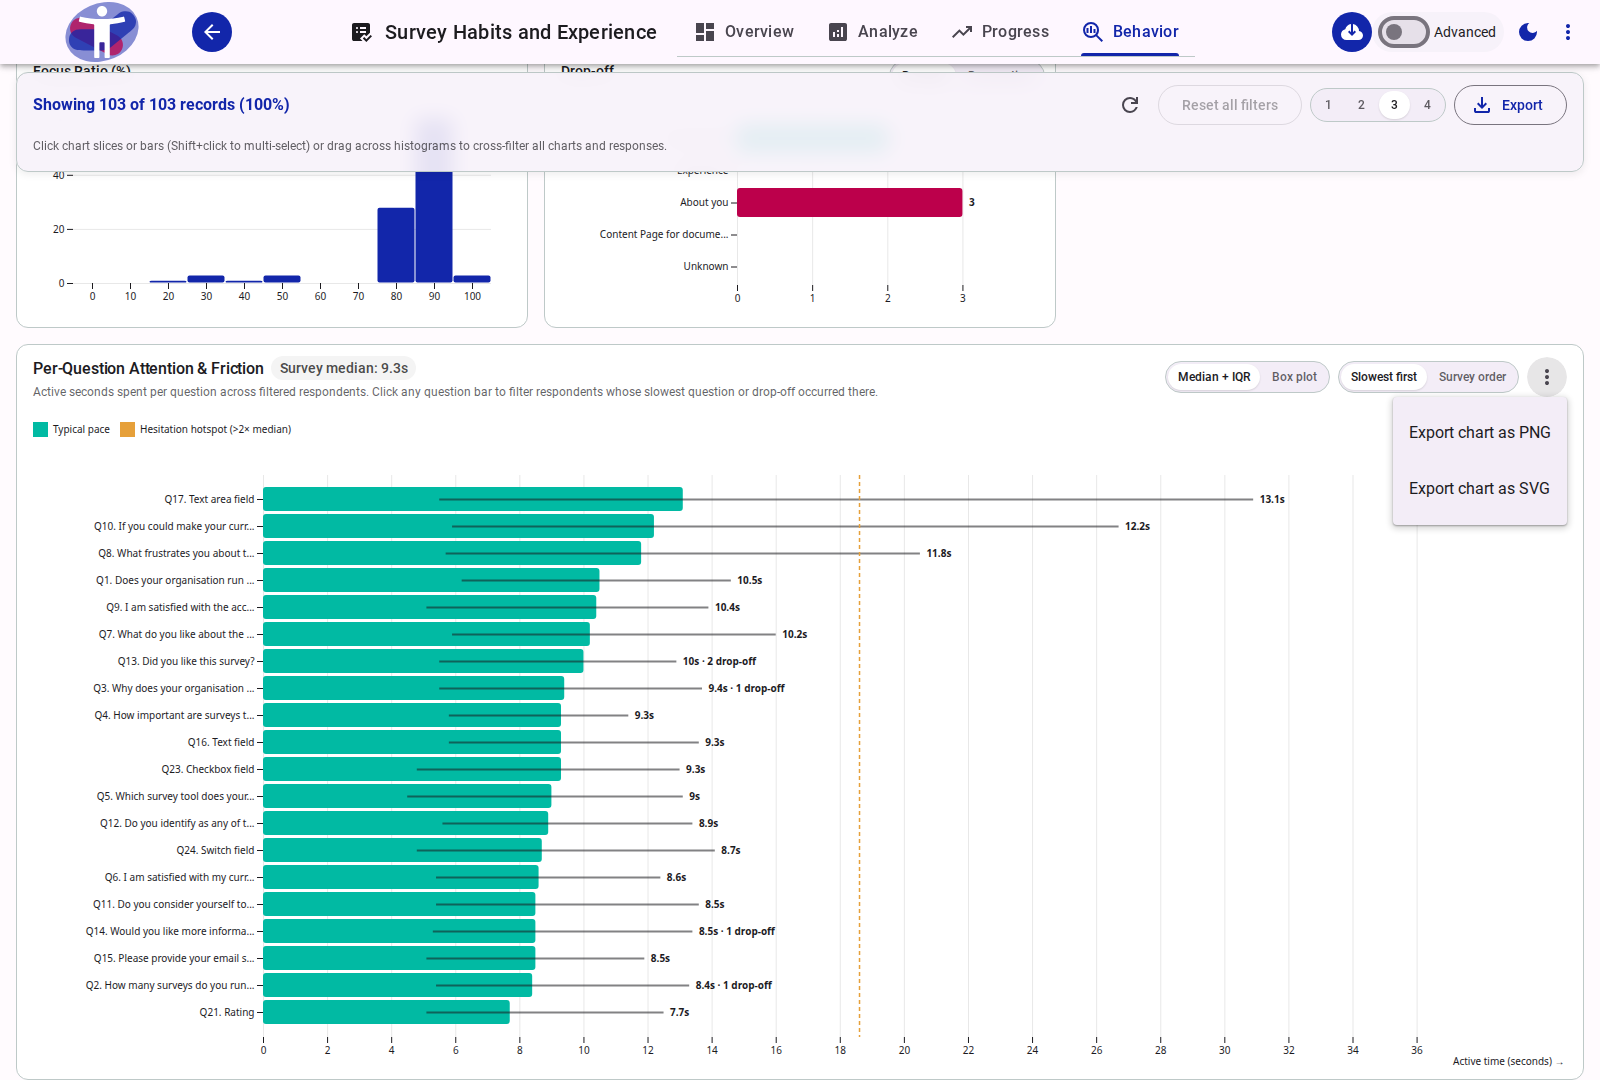
The card header also holds the sort toggle. You can:
- Switch between Median + IQR and Box plot representations.
- Switch sort order between Slowest first (prioritizing friction) and Survey order (following question order).
- Hover or focus a toggle to read a tooltip explaining what its representation shows.
- Export the friction visualization as high-resolution PNG or SVG from the card menu (three dots).
6. Interactive Behavioral Cross-Filtering
Every behavioral chart mark serves as a dynamic cross-filter. Clicking any element filters the entire behavioral view to that cohort:
Click any quality signal bar (e.g.
Paste / burstorToo fast) or a Confidence Index score bucket.The active filter chip appears in the summary bar.

Active behavioral filter chips isolate subsets (e.g. low-confidence or high-friction respondents). The entire KPI strip and respondent log immediately recalculate to reflect only that cohort:

All KPI metrics update instantly to reflect the characteristics of the filtered cohort. To reset filters, click the × on the filter chip or click Reset all filters in the toolbar.
7. Auditing Responses in the Behavioral Respondent Log
The tabular Behavioral Respondent Log below the charts provides an auditable row-by-row breakdown of each session:
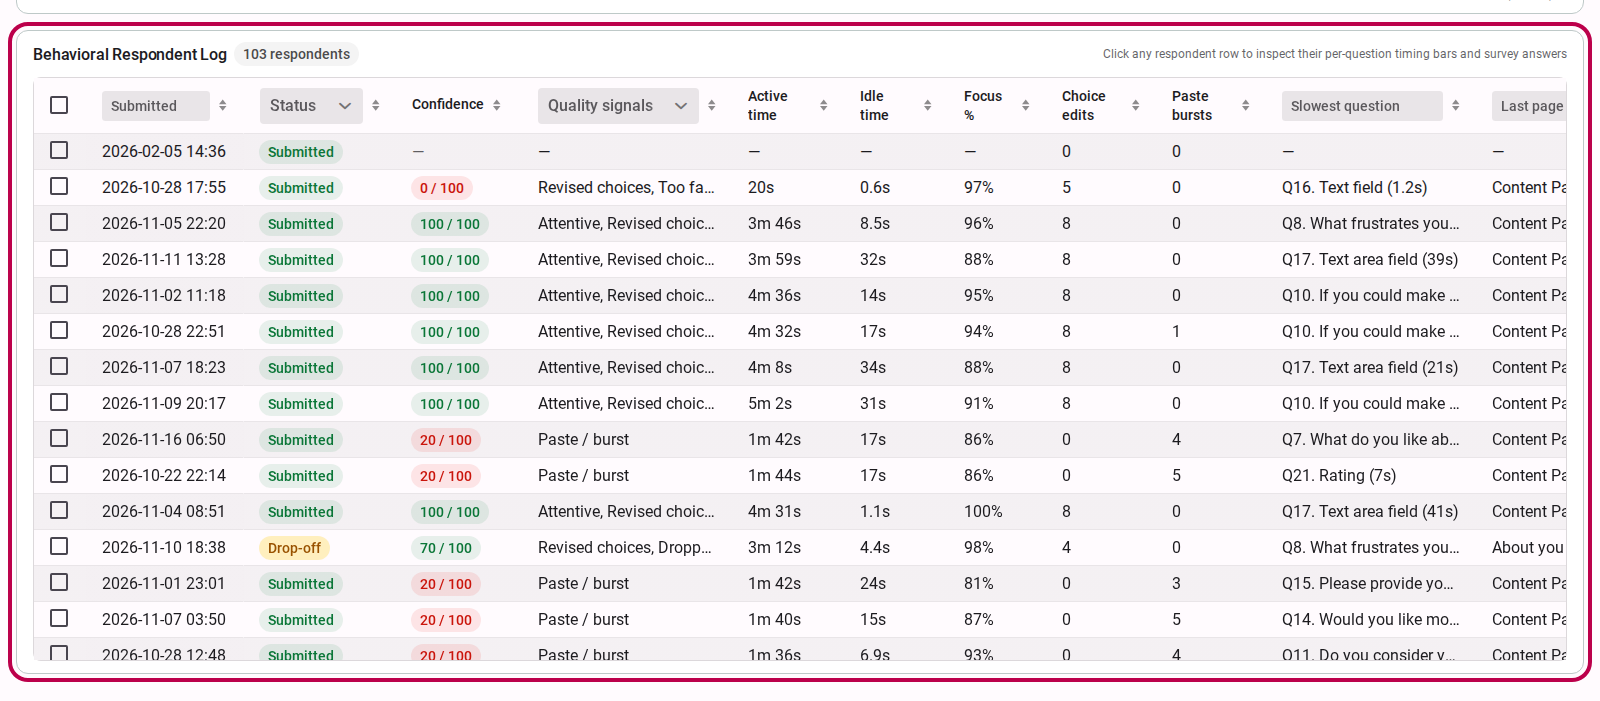
Columns include:
- Checkbox: Selection control for bulk exclusion.
- Submitted: Submission date and time.
- Status: Completed (
Submitted) or partial (Drop-off). - Confidence: Color-coded Confidence score badge (green for scores of 70 or more, amber for 40 to 69, red below 40).
- Quality Signals: Active flags assigned to the respondent.
- Active Time & Idle Time: Clean separation of active interaction versus idle wait time.
- Focus %: Proportion of session time spent inside the survey tab.
- Choice edits & Paste bursts: Raw event counts.
- Slowest question: The specific question where this respondent spent the most time.
You can sort by any column header or use the column filter inputs to isolate specific patterns (for example a confidence score below 50, or an active time below 10 seconds).
8. Inspecting Individual Respondent Timelines
To analyze a specific respondent's trajectory through the survey:
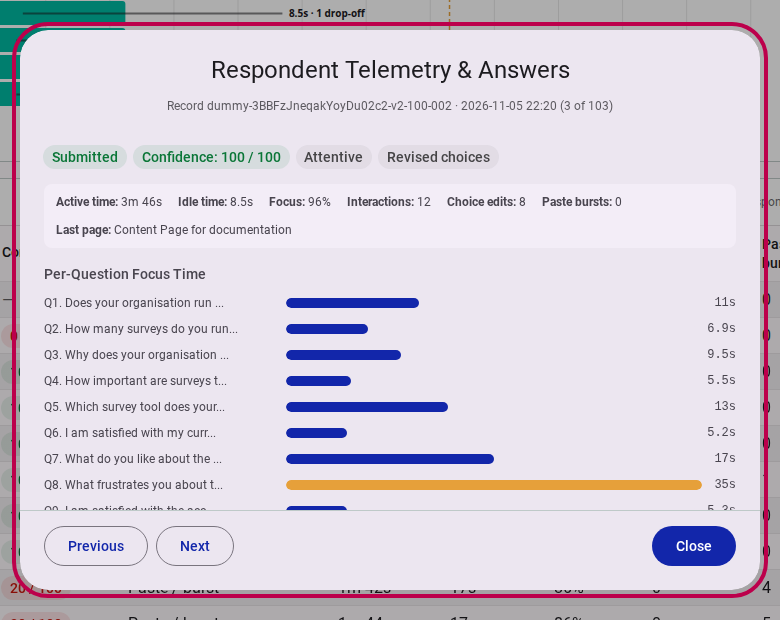
- Click any row in the Respondent Log to open the Respondent Inspector dialog.
- The inspector displays:
- Overall session metrics (active time, idle time, focus %, speed penalties, and interaction scores).
- Question-by-question horizontal bar timeline displaying dwell time per question.
- Distinct highlight for the respondent's slowest question and drop-off point.
9. Excluding and Restoring Low-Quality Responses
When suspicious, automated, or invalid responses are identified, researchers can exclude them from the analytical dataset while preserving complete audit compliance:
Excluding Responses
In the Behavioral Respondent Log, select the checkboxes next to the responses you want to remove (this requires edit rights on the survey). The header checkbox selects every row in the current filter.
The table header shows N selected; click Remove from dataset…:
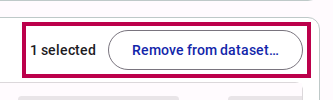
Selected rows are counted above the log, next to the Remove from dataset… action. In the exclusion dialog, select an auditable Reason:
- Test data: pre-launch checks, internal trials, and QA submissions.
- Likely bot: automated submissions flagged by instantaneous text entry or impossible completion speeds.
- Duplicate: multiple entries from the same respondent or device.
- Other: any other reason; a Note is required and explains what it was.
Add a Note when needed and click Remove.
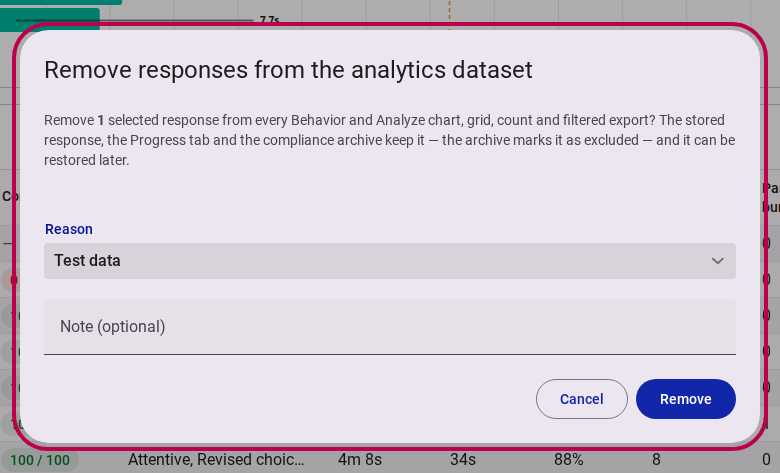
The removal dialog records a reason and, for Other, a required explanatory note.
Excluded responses are immediately omitted from all Analyze charts, behavioral KPIs, and filtered browser exports. The same removal tool is available on the Analyze tab: turn on Advanced and use the response grid.
Archival and Audit Preservation
Exclusion never permanently deletes survey data. The original submission remains safely stored in the response database, the raw Progress tab, and the compliance archive.
Reviewing and Restoring Excluded Responses
- When excluded responses exist, an Excluded (N) button appears in the toolbar showing the count.
- Click the button to open the list of excluded records. Each entry shows the exclusion reason, note, submission date, and the operator and timestamp of the exclusion.
- Click Restore next to any record to reinstate it into the analytical dataset.
10. Advanced Behavioral Statistics
Toggle on Advanced in the top toolbar to display a live statistical summary strip below each behavioral card:
- Numeric Metrics (Confidence Index): Displays n, Missing, Mean, SD, Median, IQR, and Range.
- Categorical Metrics (Quality Signals): Displays n, Missing, Top signal with percentage share, and total Categories.
See Behavioral Analytics Reference for complete metric specifications and formulas.
11. Exporting Behavioral Datasets
To analyze timing paradata or train statistical models outside the platform:
- Click the Export button in the behavioral toolbar.
- Tick I understand my responsibilities to acknowledge the data privacy notice.
- Select Download from this browser to download the behavioral dataset matching your active filters.
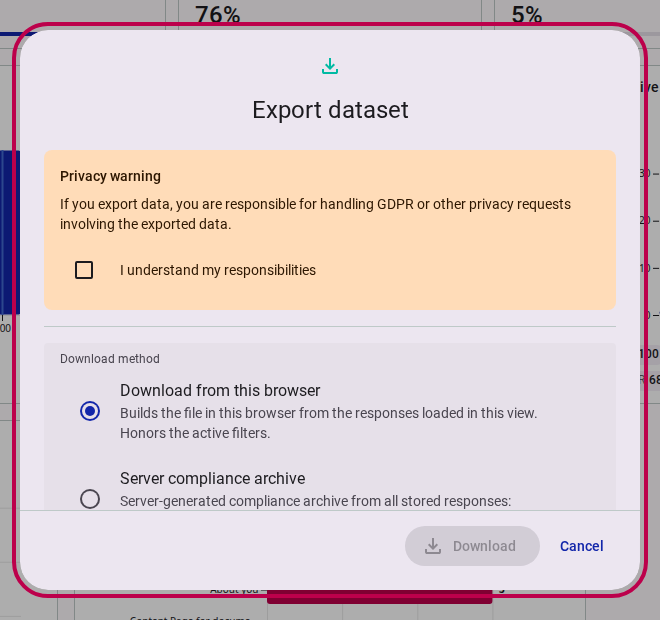
The browser download generates a row-by-row dataset with all Behavioral Respondent Log indicators and question-level active durations.
Detailed Export Options
For complete instructions on configuring metadata columns, raw codes vs. humanized labels, multi-value separators, or downloading the full server compliance archive, see How to Export Survey Data.
Related Content
- How to Analyze Survey Responses: Explore question distributions, cross-filter demographic cohorts, and customize chart views.
- How to Export Survey Data: Export behavioral paradata or the full server compliance archive.
- Behavioral Analytics Reference: Mathematical formulas, scoring algorithms, quality signal predicates, and exclusion taxonomy.
- Survey Analytics Workbench Reference: Specifications for UI controls, card parameters, and statistical formulas.
- Understanding Respondent Behavior and Data Quality: Conceptual background on satisficing theory, paradata history, cognitive latency, and survey methodology literature.