
Analyzing Broadcast Performance
Per-broadcast analytics enable channel administrators to track subscriber engagement, verify delivery health, and compare language segment performance.
Step 1: Open Broadcast Analytics
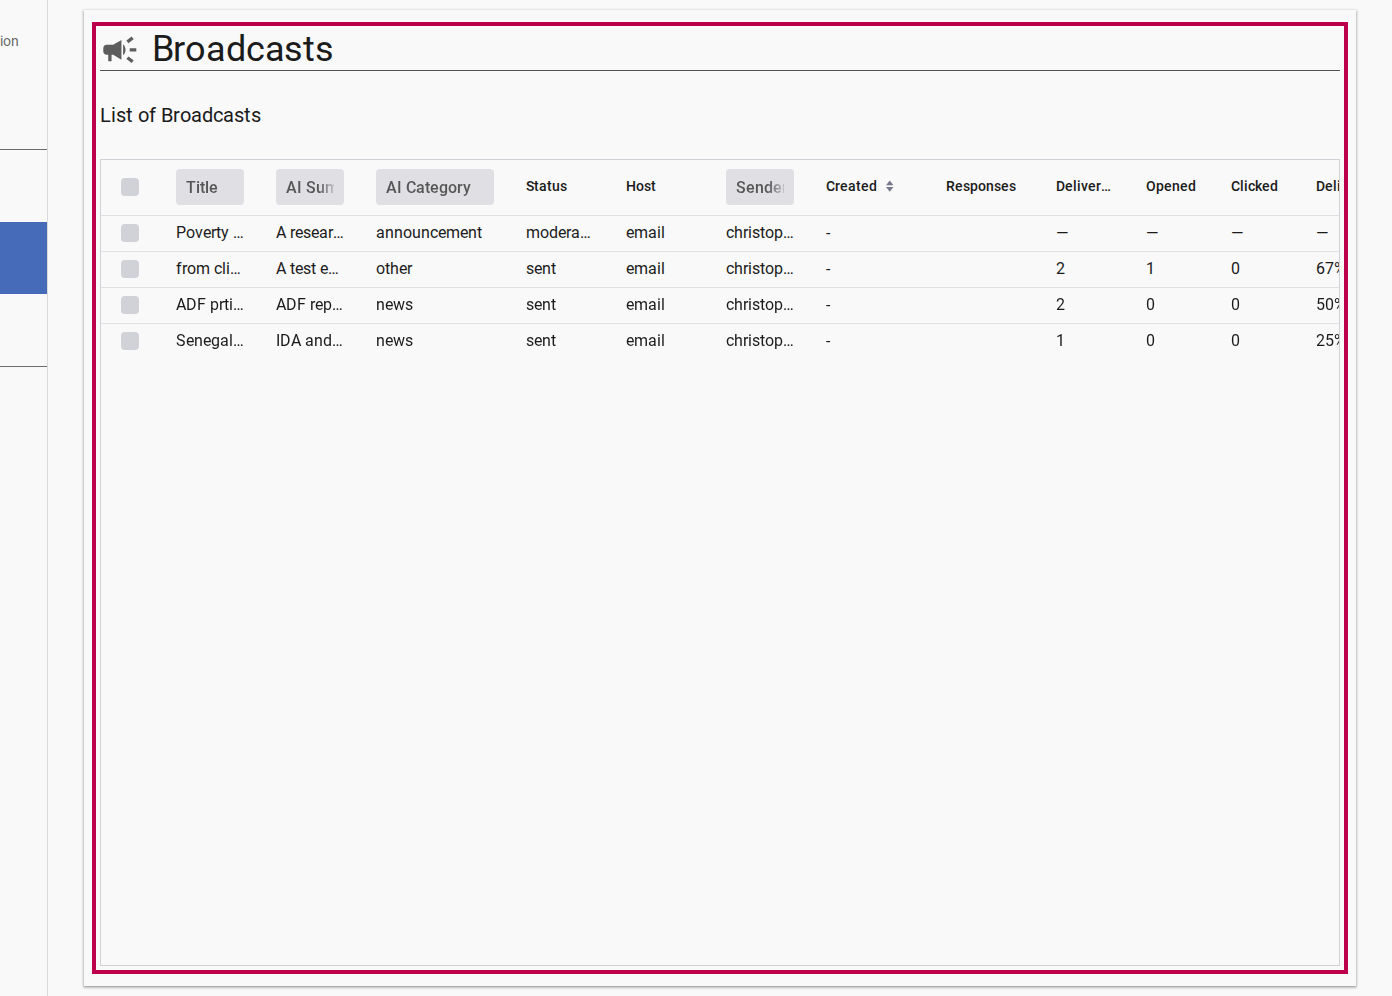
- Navigate to Admin > Broadcasts.
- Locate a broadcast with status
sent. - Click the broadcast row to expand its details and analytics panel.
Step 2: Key Performance Indicators (KPIs)
The performance dashboard reports real-time metrics updated via Mailgun webhooks:
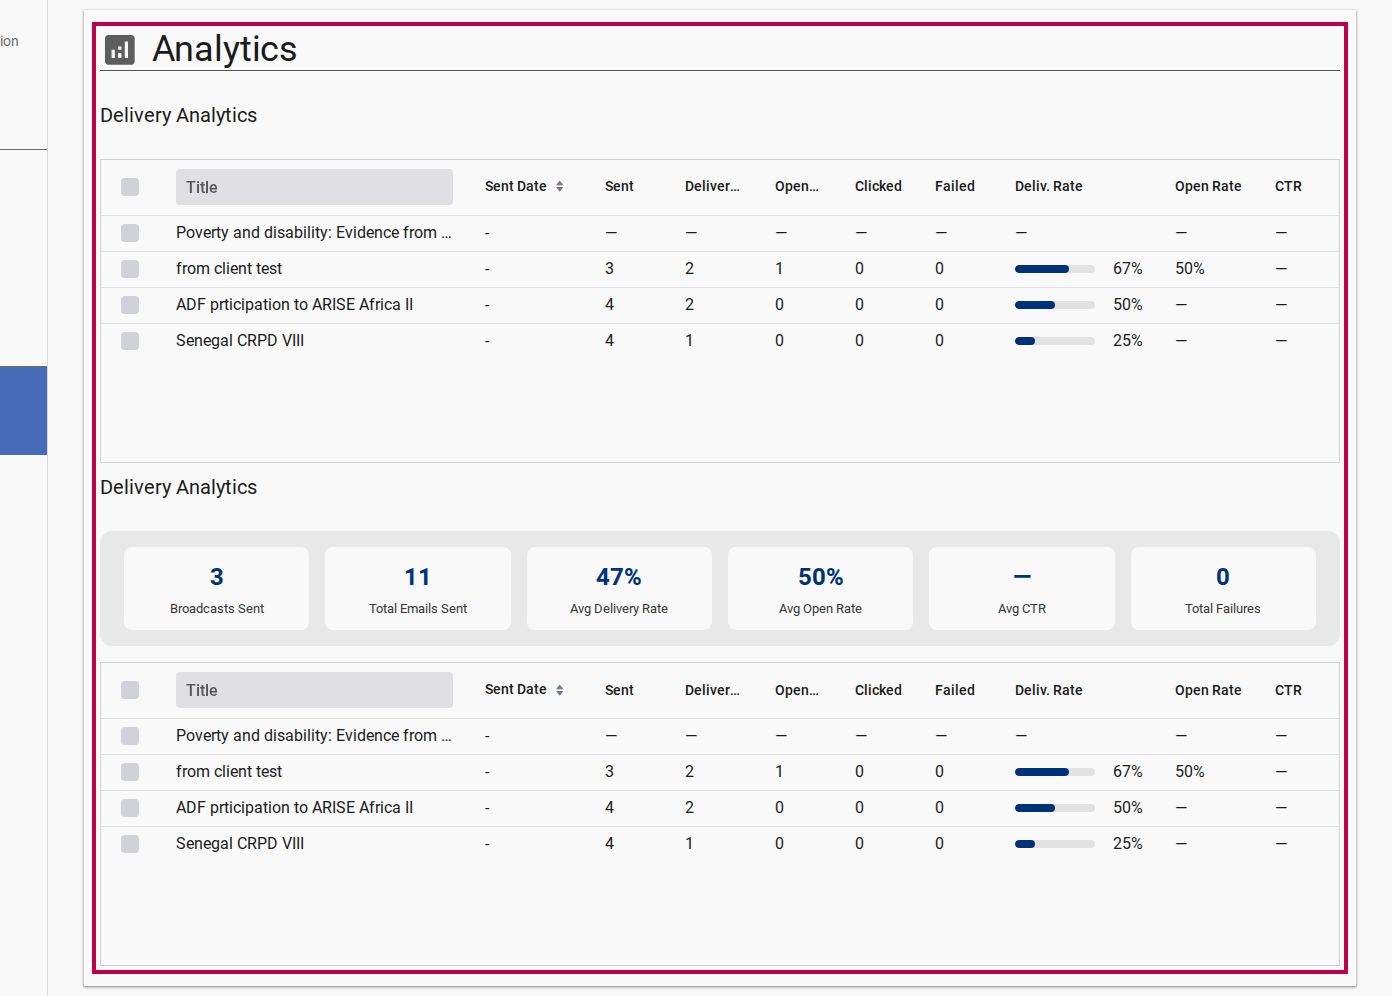
- Total Recipients: Total subscriber accounts included in the send list
- Delivery Rate (%): Percentage of emails successfully delivered to subscriber mailboxes
- Open Rate (%): Percentage of delivered messages opened by recipients
- Click-Through Rate (%): Percentage of opened emails where links were clicked
- Bounces / Failures: Total permanently or temporarily rejected email addresses
- Response Count: Number of threaded subscriber replies attached to this broadcast. Expanding the grid row reveals the full flat response thread.
Step 3: Segment Analytics by Language
To compare engagement across different language communities:
- In the broadcast analytics view, locate the Language Breakdown tab.
- Select a target language (e.g.
English,French,Portuguese,Arabic). - View the specific delivery and open rates calculated for subscribers who received that translation version.